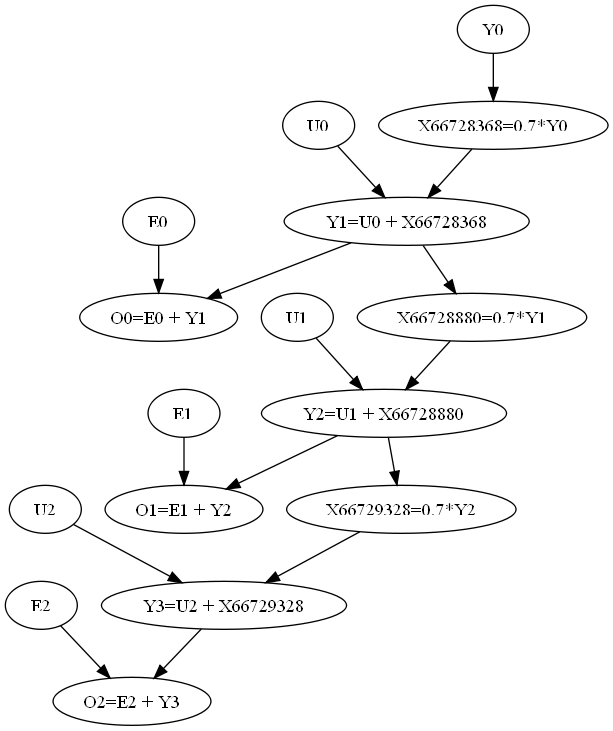
Kalman filter with control input
| ... from pacal import *
|
||
|
.
|
||
Using compiled interpolation routine
Compiled sparse grid routine not available
| ... from pylab import figure, show, zeros, plot, legend, subplot, rc
from matplotlib.lines import Line2D
from pacal.depvars.models import Model
from pacal.depvars.nddistr import NDProductDistr, Factor1DDistr
from numpy import pi, std, array, concatenate, mean, abs
from numpy.random import seed
seed(1)
rc('axes', labelsize=18)
rc('xtick', labelsize=15.0)
rc('ytick', labelsize=15.0)
rc('legend', fontsize=17.0)
linestyles = ["-", "--", "-.", ":"]
pfargs = {"linewidth":3, "color":"k", "dash_joinstyle":"round"}
params.interpolation_nd.maxq = 2
params.interpolation.maxn = 50
params.interpolation_pole.maxn = 50
params.interpolation_nd.debug_info = False
params.interpolation.debug_info = False
params.models.debug_info = True
|
||
|
.
|
||
Model
Y(i) = K * Y(i-1) + U
O(i) = Y(i) + E(i), i=0,...,n-1
| ... A = BetaDistr(3, 3, sym="A") # parameter of equation
Y0 = UniformDistr(-0.5, 0.5, sym="Y0") # initial value
n = 3 # number time points
h = 1.0 / n
K = 0.7
Y = [] # list of states
O, E, U = [], [], [] # lists of observations and errors
for i in xrange(n):
U.append(UniformDistr(-0.2, 0.2, sym="U{0}".format(i)))
if i == 0:
Y.append(Y0 * K + U[i])
else:
Y.append(Y[i - 1] * K + U[i])
Y[i].setSym("Y" + str(i + 1))
ei = NormalDistr(0.05, 0.1) | Between(-0.4, 0.4)
ei.setSym("E{0}".format(i))
E.append(ei)
O.append(Y[-1] + E[-1])
O[-1].setSym("O{0}".format(i))
#print O[-1].range(), O[-1].range_()
M = Model(U + [Y0] + E, Y + O)
print M
|
||
|
.
|
||
Model:
free_vars:
   E0 ~ N(0.05,0.1) | X>-0.4 | X<0.4
   E1 ~ N(0.05,0.1) | X>-0.4 | X<0.4
   E2 ~ N(0.05,0.1) | X>-0.4 | X<0.4
   U0 ~ U(-0.2,0.2)
   U1 ~ U(-0.2,0.2)
   U2 ~ U(-0.2,0.2)
   Y0 ~ U(-0.5,0.5)
dep vars:  X66421040(1), X66421584(10), X66422032(10), Y1(11), O0(11), Y2(11), O1(11), Y3(11), O2(11)
Equations:
O1 = E1 + Y2(11)
O0 = E0 + Y1(11)
O2 = E2 + Y3(11)
X66422032 = 0.7*Y2(10)
X66421040 = 0.7*Y0(1)
X66421584 = 0.7*Y1(10)
Y2 = U1 + X66421584(11)
Y1 = U0 + X66421040(11)
Y3 = U2 + X66422032(11)
Factors:
F_0 (U0)<class 'pacal.depvars.nddistr.Factor1DDistr'>
F_1 (U1)<class 'pacal.depvars.nddistr.Factor1DDistr'>
F_2 (U2)<class 'pacal.depvars.nddistr.Factor1DDistr'>
F_3 (Y0)<class 'pacal.depvars.nddistr.Factor1DDistr'>
F_4 (E0)<class 'pacal.depvars.nddistr.Factor1DDistr'>
F_5 (E1)<class 'pacal.depvars.nddistr.Factor1DDistr'>
F_6 (E2)<class 'pacal.depvars.nddistr.Factor1DDistr'>

| ... M.toGraphwiz(f=open('bn.dot', mode="w+"))
|
||
|
.
|
||
Simulation with signal filtering
| ... nT = 100
u = zeros(nT)
t = zeros(nT)
Yorg = zeros(nT)
Ynoised = zeros(nT)
Ydenoised = zeros(nT)
Udenoised = zeros(nT)
yi = 0.0
ydenoise = 0.0
ynoise = 0.0
y = 0.0
figure()
for i in range(nT):
t[i] = i
# Deterministic simultation
u[i] = 0.1 * sign(sin(4 * pi * i / nT))
y = y * K + u[i]
Yorg[i] = y
Ynoised[i] = y + E[0].rand()
# Inference (Y[i] | O[i-n+1], ..., O[i]
if i > n - 1:
MY = M.inference(wanted_rvs=[Y[-1]], cond_rvs=O + U , cond_X=concatenate((Ynoised[i - n + 1:i + 1], u[i - n + 1:i + 1])))
ydenoised = MY.as1DDistr().median()
Ydenoised[i] = ydenoised
#MY.as1DDistr().boxplot(i, width=0.2, useci=0.1)
plot(t, u, 'k-', label="U", linewidth=1.0)
|
||
|
.
|
||
condition on variable:  U0 = 0.1
condition on variable:  U1 = 0.1
condition on variable:  U2 = 0.1
exchange free variable:  Y0 with dependent variable X66421040
eliminate variable:  Y0
exchange free variable:  X66421040 with dependent variable Y1
eliminate variable:  X66421040
exchange free variable:  E0 with dependent variable O0
eliminate variable:  E0
condition on variable:  O0 = 0.208331218668
exchange free variable:  Y1 with dependent variable X66421584

[... long output removed ...]

eliminate variable:  Y1
exchange free variable:  X66421584 with dependent variable Y2
eliminate variable:  X66421584
exchange free variable:  E1 with dependent variable O1
eliminate variable:  E1
condition on variable:  O1 = -0.559344619112
exchange free variable:  Y2 with dependent variable X66422032
eliminate variable:  Y2
exchange free variable:  X66422032 with dependent variable Y3
eliminate variable:  X66422032
exchange free variable:  E2 with dependent variable O2
eliminate variable:  E2
condition on variable:  O2 = -0.253443765901
| ... plot(t, Ynoised, 'k.--', label="O", linewidth=1.0)
plot(t, Yorg, 'k-.', label="Y original", linewidth=2.0)
plot(t, Ydenoised, 'k-', label="Y denoised", linewidth=2.0)
legend(loc='lower left')
|
||
|
.
|
||
| ... show()
|
||
|
.
|
||

Error of estimation: mean squared error and mean absolute deviation
| ... print "mse=", sqrt(mean((Yorg - Ynoised) ** 2)), sqrt(mean((Yorg - Ydenoised) ** 2))
|
||
|
.
|
||
mse= 0.113577897886 0.0387027290968
| ... print "mae=", mean(abs(Yorg - Ynoised)), mean(abs(Yorg - Ydenoised))
|
||
|
.
|
||
mae= 0.0915492801332 0.0270451354013