Demo of central limit theorem
| ... import sys
from pylab import *
from pacal import *
|
||
|
.
|
||
Using compiled interpolation routine
| ... colors = "kbgrcmy"
def central_limit_demo(X, N = 5, xmin = None, xmax = None, ymax = None, **args):
figure()
title("Limit of averages of " + X.getName())
X.plot(linewidth = 4, color = "c", **args)
Y = X
print "Limit of averages of " + X.getName() + ": ",
for i in xrange(N-1):
print i+2,
sys.stdout.flush()
Y += X
(Y/(i+2)).plot(color = colors[i%len(colors)], **args)
if xmin is not None:
xlim(xmin = xmin)
if xmax is not None:
xlim(xmax = xmax)
ylim(ymin = 0)
if ymax is not None:
ylim(ymax = ymax)
print
show()
|
||
|
.
|
||
uniform distribution
| ... X = UniformDistr(0,1)
central_limit_demo(X, xmin=-0.1, xmax=1.1)
|
||
|
.
|
||
Limit of averages of U(0,1): 2 3 4 5

| ... |
||
|
.
|
||
Chi^2_1
| ... X = ChiSquareDistr(1)
central_limit_demo(X, N=10, ymax=1.5, xmax=3)
|
||
|
.
|
||
Limit of averages of Chi2(1): 2 3 4 5 6 7 8 9 10

| ... |
||
|
.
|
||
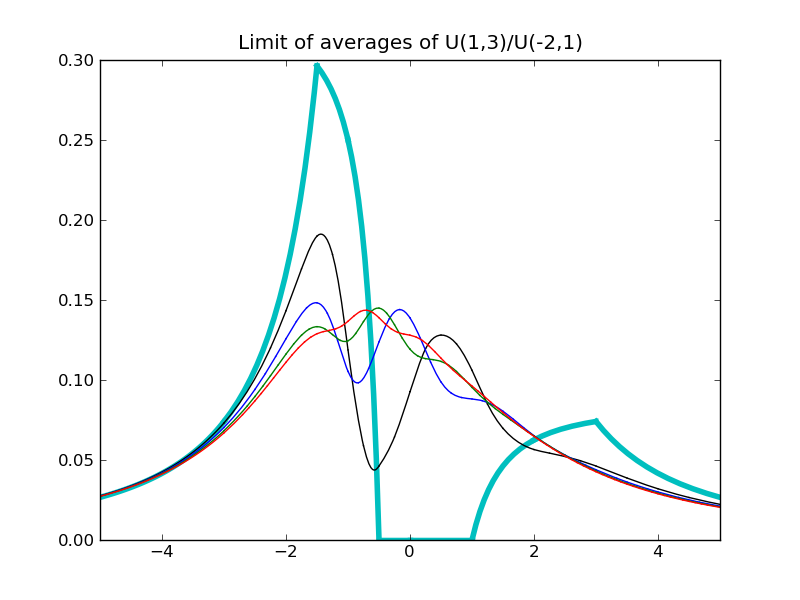
a ratio distribution
| ... X = UniformDistr(1,3) / UniformDistr(-2,1)
central_limit_demo(X, N = 5, xmin=-5, xmax=5)
|
||
|
.
|
||
Limit of averages of U(1,3)/U(-2,1): 2 3 4 5

| ... |
||
|
.
|
||
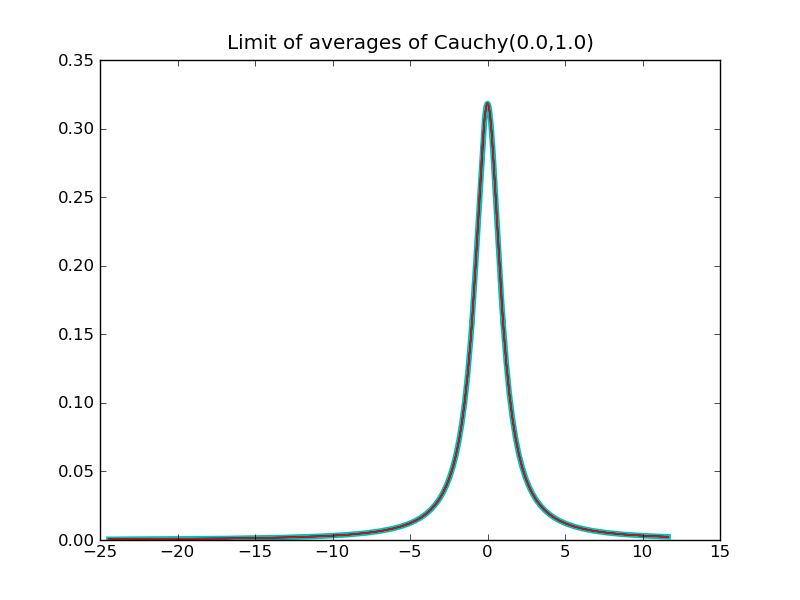
Cauchy distribution
| ... X = CauchyDistr()
central_limit_demo(X)
|
||
|
.
|
||
Limit of averages of Cauchy(0.0,1.0): 2 3 4 5

| ... |
||
|
.
|
||
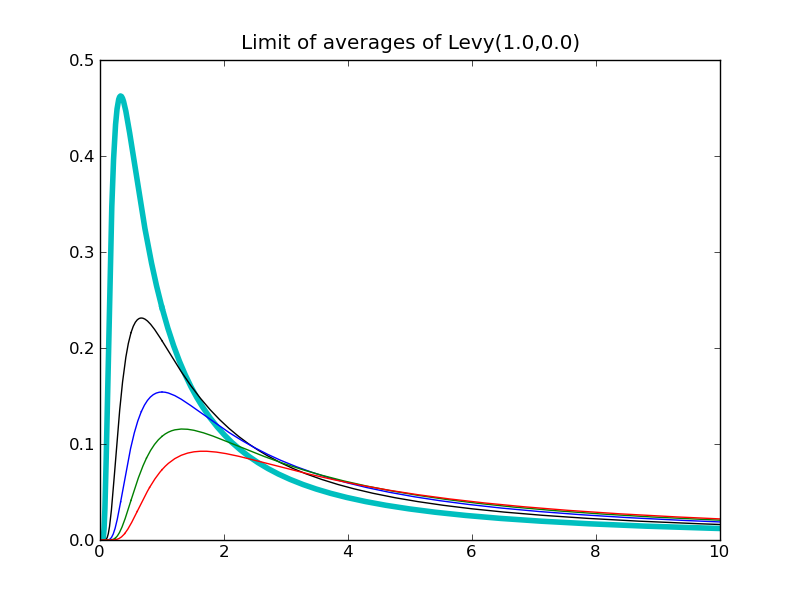
Levy distribution
| ... X = LevyDistr()
central_limit_demo(X, xmax=10)
|
||
|
.
|
||
Limit of averages of Levy(1.0,0.0): 2 3 4 5

| ... |
||
|
.
|
||