| ... """Joint distribution of two order statistics.
Distribution of sample range."""
from pylab import figure, legend, title
from pacal import *
|
||
|
.
|
||
Using compiled interpolation routine
Compiled sparse grid routine not available
| ... X = NormalDistr(0, 1, sym="X")
CIJ = IJthOrderStatsNDDistr(X, n=5, i=1, j=5)
X1, X5 = CIJ.marginals
X1.setSym("X1")
X5.setSym("X5")
M = TwoVarsModel(CIJ, X5 - X1)
R = M.eval()
R.plot(color="k", linewidth=2.0, linestyle="-", label=r'$X_{(5)} - X_{(1)}$'+'\n(sample range)')
X1.plot(color="k", linewidth=2.0, linestyle="--", label=r'$X_{(1)}$')
X5.plot(color="k", linewidth=2.0, linestyle=":", label=r'$X_{(5)}$')
legend()
figure()
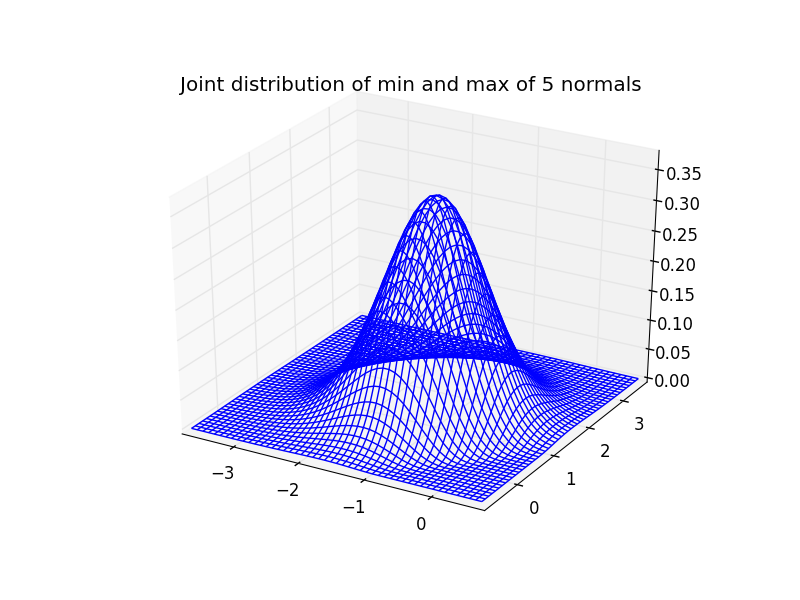
CIJ.plot()
title("Joint distribution of min and max of 5 normals")
|
||
|
.
|
||

Compare with values given in SAS/QC manual (functions: d2, d3)
| ... print repr(R.mean())
|
||
|
.
|
||
2.3259289472810405
| ... print repr(R.var()), repr(R.std())
|
||
|
.
|
||
0.74663760093428744 0.86408194109950442
| ... R.summary()
|
||
|
.
|
||
============= summary =============
  PDISTR(-inf,inf)
                mean  =  2.3259289472810405
                 var  =  0.74663760093428744
            skewness  =  0.46551383286460202
            kurtosis  =  3.1691477882127366
             entropy  =  1.2509739123829031
              median  =  2.256882493026221
                mode  =  1.9999999697581552
            medianad  =  0.5844916749951602
      iqrange(0.025)  =  3.3473546743420313
            ci(0.05)  =  (0.8496716716531508, 4.197026345995182)
               range  =  (-inf, inf)
             tailexp  =  (0, -117.85789031893026)
             int_err  =  -4.4408920985006262e-16
| ... show()
|
||
|
.
|
||